
Loop360 Analytics
An advanced SaaS & IoT platform to reinvent data management and Machine control in the beverage industry


Project Goals
We aimed to design a platform that would:
Deliver actionable data to different user roles: HoReCa managers, beverage operators, and technicians
Translate complex machine data into useful business insights
Help clients increase profits, reduce losses, and operate more sustainably
Respect the technical constraints of each type of machine, while maximizing the value of available data
CLIENT
Drinkotec – Swiss pioneers in beverage technology. Drinkotec aims to enhance efficiency, reduce waste, and boost profitability across the beverage industry.
PROBLEM STATEMENT
When I joined the team, LOOP 360 Analytics was still in its MVP phase — with limited data visibility, no clear user flows, and only the most basic functionality in place.
The vision, however, was ambitious: to design a robust, user-centered SaaS IoT platform capable of collecting, processing, and displaying data from more than 10 types of beverage dispensing machines — each with its own unique technical constraints.
Our goal was to turn LOOP 360 into a business-critical tool that would enable HoReCa managers, beverage operators, and technicians to increase profitability, reduce waste, and make smarter operational decisions — all powered by real-time machine data.
OUR CHALLENGE
This wasn’t just about designing a clean UI — it was about defining what data we could technically retrieve, which data actually mattered to our users, and how to present it in a way that would deliver real business value.
As a product and UX/UI designer, I took responsibility for bridging the gap between machine logic and user logic:
This is how metrics like SPR (Sold-to-Poured Ratio) were born — custom KPIs that allowed our clients to monitor product loss, track team performance, and maximize efficiency.
As a product and UX/UI designer, I took responsibility for bridging the gap between machine logic and user logic:
- I first had to deeply understand each machine's data output and limitations.
- Then I worked closely with stakeholders and users to define the key metrics they needed.
- Finally, I mapped both sides together to design a data layer and interface that were feasible, scalable, and valuable.
This is how metrics like SPR (Sold-to-Poured Ratio) were born — custom KPIs that allowed our clients to monitor product loss, track team performance, and maximize efficiency.
How do you create a user-centered IoT platform that adapts to the unique needs of each user type and the varying technical limitations of different machines?

OUR PROCESS
STEP 1
Deep technical discovery
Goal: Understand the capabilities and limitations of each dispensing machine.
What I did:
Result: A clear framework of what’s technically possible — laying the foundation for a platform that respects hardware constraints but delivers maximum value.
What I did:
- Conducted sessions with engineers and developers to study how different machines operate.
- Mapped all available data points (e.g. liters poured, temperature, cleaning cycles, etc.).
- Identified which data was consistent across devices and could be standardized.
Result: A clear framework of what’s technically possible — laying the foundation for a platform that respects hardware constraints but delivers maximum value.

STEP 2
Collaborative product scoping with stakeholders
Goal: Define the vision and functional core of the platform.
What I did:
Result: A product blueprint grounded in user value and business priorities.
What I did:
- Ran product definition workshops with internal stakeholders, developers, and field experts.
- Prioritized features based on business impact: diagnostics, real-time sales, smart inventory tracking.
- Discussed revenue-generating opportunities the platform could unlock for clients.
Result: A product blueprint grounded in user value and business priorities.
STEP 3
User research &
persona development
Goal: Understand the goals, pain points, and workflows of each user type.
What I did:
Result: A set of clearly defined, behaviorally accurate personas that ensured every interface, metric, and interaction in LOOP 360 Analytics would serve a real-world purpose — not just technical possibilities.
What I did:
- To ensure LOOP 360 Analytics would address real operational needs, I led a qualitative research phase involving interviews with key user groups:
- HoReCa Managers — responsible for daily operations, team motivation, product performance, and sales analysis
- Beverage Operators — focused on inventory movement, refill planning, and maintaining product quality across multiple sites
- Technicians — accountable for equipment uptime, remote diagnostics, and intervention scheduling
Result: A set of clearly defined, behaviorally accurate personas that ensured every interface, metric, and interaction in LOOP 360 Analytics would serve a real-world purpose — not just technical possibilities.
User persona 1
HoRECA Manager
Name: Caroline
Age: 38
Role: Restaurant Manager (HoReCa)
Industry: Hospitality & Food Service
Location: Geneva, Switzerland
Age: 38
Role: Restaurant Manager (HoReCa)
Industry: Hospitality & Food Service
Location: Geneva, Switzerland
Bio
Caroline manages a mid-sized restaurant with multiple staff and high daily turnover. Her responsibilities include sales performance, team coordination, promotions, and profitability. While she has strong operational instincts, she lacks real-time visibility into product sales, inventory usage, and staff performance. She wants to make more informed decisions, set measurable goals, and optimize resource allocation.
Pain Points
- No real-time overview of sales or drink performance
- Difficulty identifying which team members are underperforming
- Manual tracking of inventory and frequent over/understocking
- Limited insight into what’s affecting margins
Goals
- Boost overall profitability by identifying top-performing products
- Track and motivate team performance
- Forecast inventory needs based on sales patterns
- Reduce waste and improve sustainability reporting
What she needs from LOOP 360:
- A real-time dashboard for sales & performance
- Visual KPIs like SPR (Sold-to-Poured Ratio), most sold products, and comparison by week/month
- Alerts for low inventory and machine issues
- Simple data that she can explain to the team
User persona 2
Beverage Operator
Name: Marco
Age: 45
Role: Regional Beverage Operations Manager
Industry: Beverage Distribution
Location: Lausanne, Switzerland
Age: 45
Role: Regional Beverage Operations Manager
Industry: Beverage Distribution
Location: Lausanne, Switzerland
Bio
Marco oversees the operations of self-service dispensing machines installed across bars, hotels, and corporate cafeterias. He is responsible for ensuring timely replenishment, minimizing waste, and ensuring consistency in product quality. He’s constantly on the move and needs to be able to make quick operational decisions based on machine and sales data.
Pain Points
- Limited field visibility — he doesn’t know what’s happening at each site in real time
- Replenishment cycles often driven by guesswork, not data
- No quick way to check freshness or issues remotely
- Reactive problem-solving leads to higher costs
Goals
- Ensure all machines are properly stocked and functional
- Reduce unnecessary truck dispatches and optimize routing
- Anticipate demand patterns and plan restocks
- Maintain brand consistency across all endpoints
What he needs from LOOP 360:
- Mobile-friendly overview of all machines under his management
- Predictive inventory alerts and refill planning
- Quick-glance insights on freshness, keg levels, and anomalies
- Integration with routing tools to optimize field ops
User persona 3
Technician
Name: Yvan
Age: 34
Role: Field Technician
Industry: Beverage Equipment Service
Location: Lausanne, Switzerland
Age: 34
Role: Field Technician
Industry: Beverage Equipment Service
Location: Lausanne, Switzerland
Bio
Yvan services beverage dispensing machines across multiple regions. His team is responsible for maintaining equipment uptime, responding to breakdowns, and ensuring cleaning compliance. Before LOOP 360, all service was reactive — he’d only know something was wrong after a call. Now, he’s expected to be proactive, but needs the right data to do it.
Pain Points
- No centralized overview of machine health
- Difficult to know which alerts are urgent vs. minor
- Lack of documentation or error logs before arriving on site
- Overloaded with tickets without context
Goals
- Keep all machines running smoothly with minimal downtime
- Prioritize which machines to check first based on urgency
- Respond faster to technical issues before they escalate
- Reduce unnecessary site visits
What he needs from LOOP 360:
- Machine health status view
- Predictive alerts based on cleaning cycles, failures, or anomalies
- Detailed diagnostics logs accessible remotely
- Prioritization filters to know which cases matter most
STEP 4
Information architecture & wireframing
Goal: Structure the platform around user logic, not just system logic.
What I did:
Result: A navigation and data model that made complex insights simple and easy to act on.
What I did:
- To ensure LOOP 360 Analytics would address real operational needs, I led a qualitative research phase involving interviews with key user groups:
- Created role-based dashboards, each showing only relevant data for that user type.
- Designed a layered data experience — high-level overviews with the option to drill down.
- Built interactive wireframes and ran early feedback sessions.
Result: A navigation and data model that made complex insights simple and easy to act on.
Information Architecture
To ensure that each user type could intuitively access the features and data they needed, I designed a role-based information architecture. The system was structured around key workflows and priorities for technicians, HoReCa managers, and beverage operators — each receiving a personalized dashboard and navigation model. This minimized cognitive load, reduced friction, and aligned the interface with real-world use cases.
WIREFRAMES
Early Sketches & Ideations

STEP 7
Handoff &
implementation support
Goal: Ensure the final product matches the design intent.
What I did:
Result: A seamless handoff and a built product that matched our shared vision.
What I did:
- Provided detailed UI specs, documentation, and developer support.
- Participated in sprint reviews, QA sessions, and UI adjustments during development.
- The design system I created became a single source of truth for the development team, helping speed up implementation and reduce ambiguity during the handoff process.
Result: A seamless handoff and a built product that matched our shared vision.
STEP 8
Launch & client onboarding
Goal: Help clients adopt the platform and gather continuous feedback.
What I did:
Result: A successful platform launch and a foundation for continuous iteration and growth.
What I did:
- Helped prepare onboarding materials and participated in early client demos.
- Set up feedback channels to capture real usage insights.
- Supported the roadmap planning for post-launch improvements.
Result: A successful platform launch and a foundation for continuous iteration and growth.
STEP 5
UI design & smart data visualizations
Goal: Make data readable, relevant, and beautiful.
What I did:
Result: A modern, scalable UI that delivers powerful insights without overwhelming users.
What I did:
- Designed modular dashboards using visual hierarchy and clear interaction patterns.
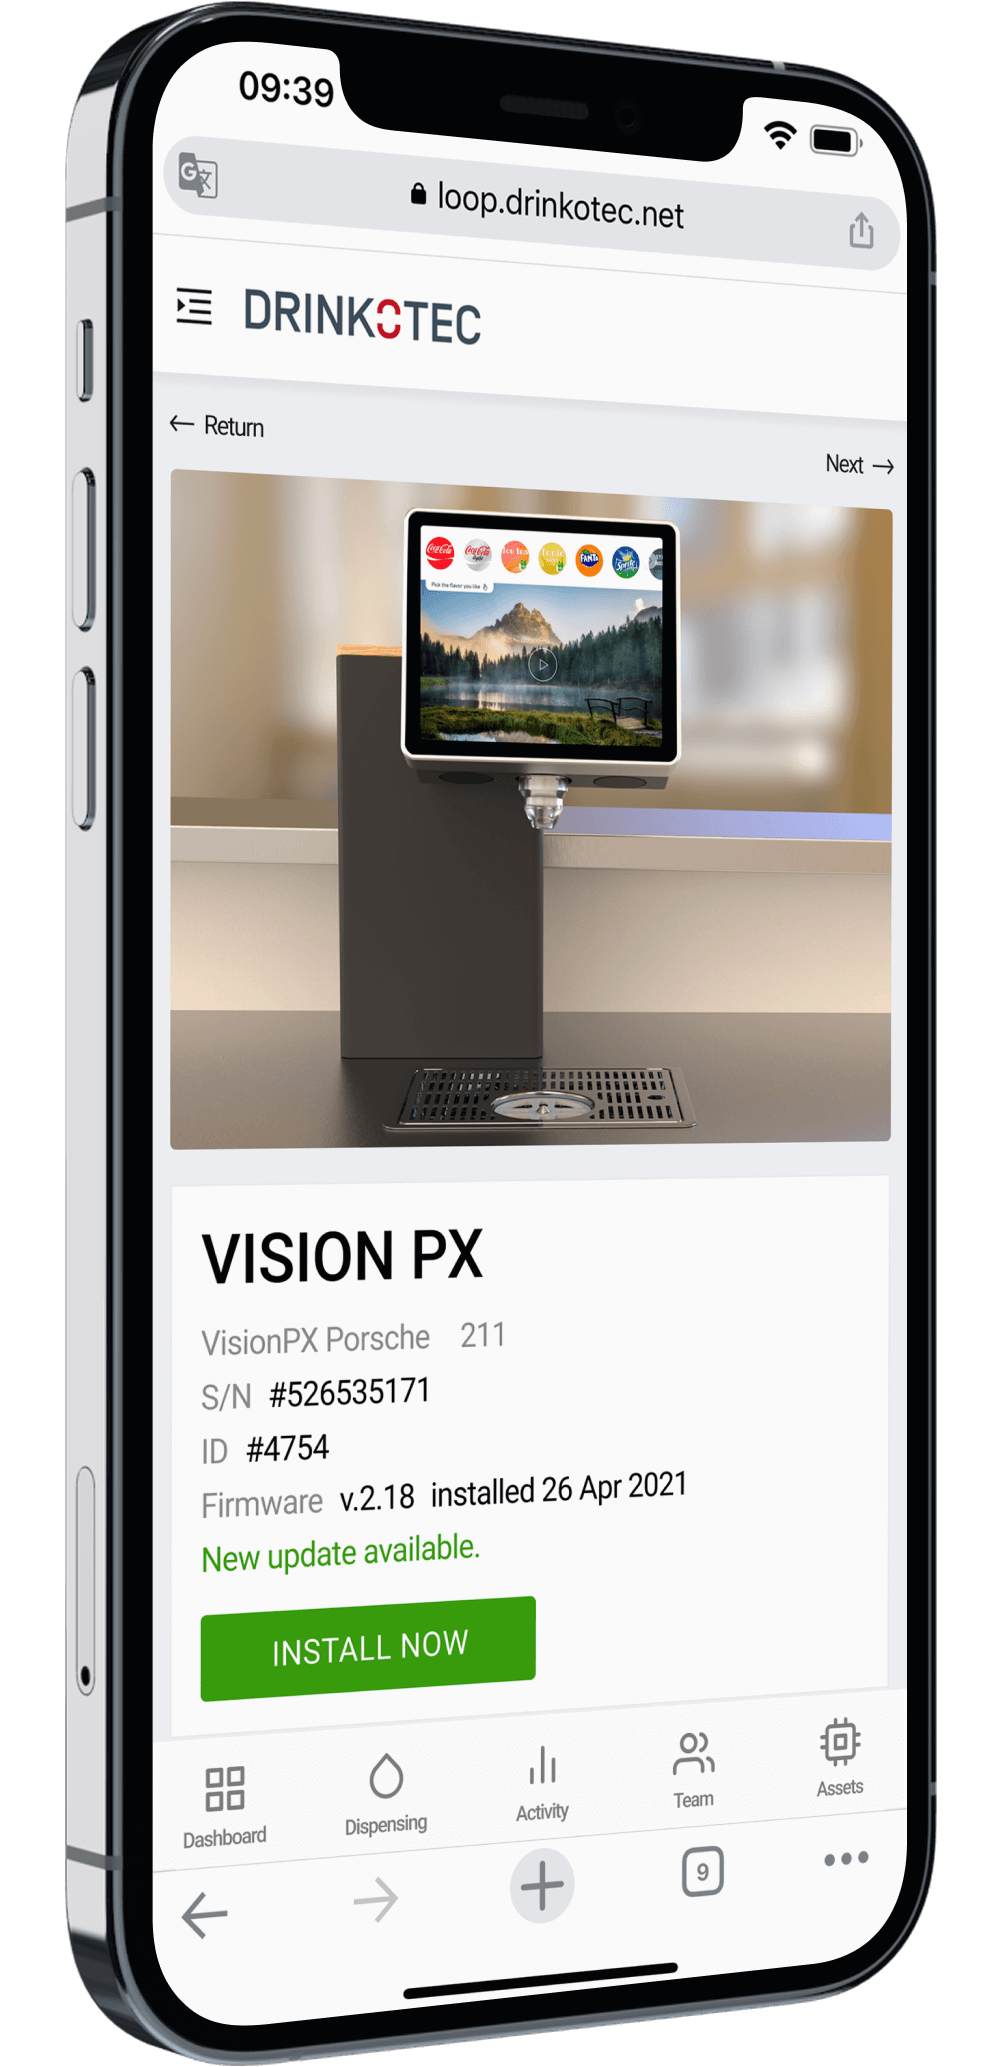
- Created a traffic-light system for machine health, allowing technicians to act quickly.
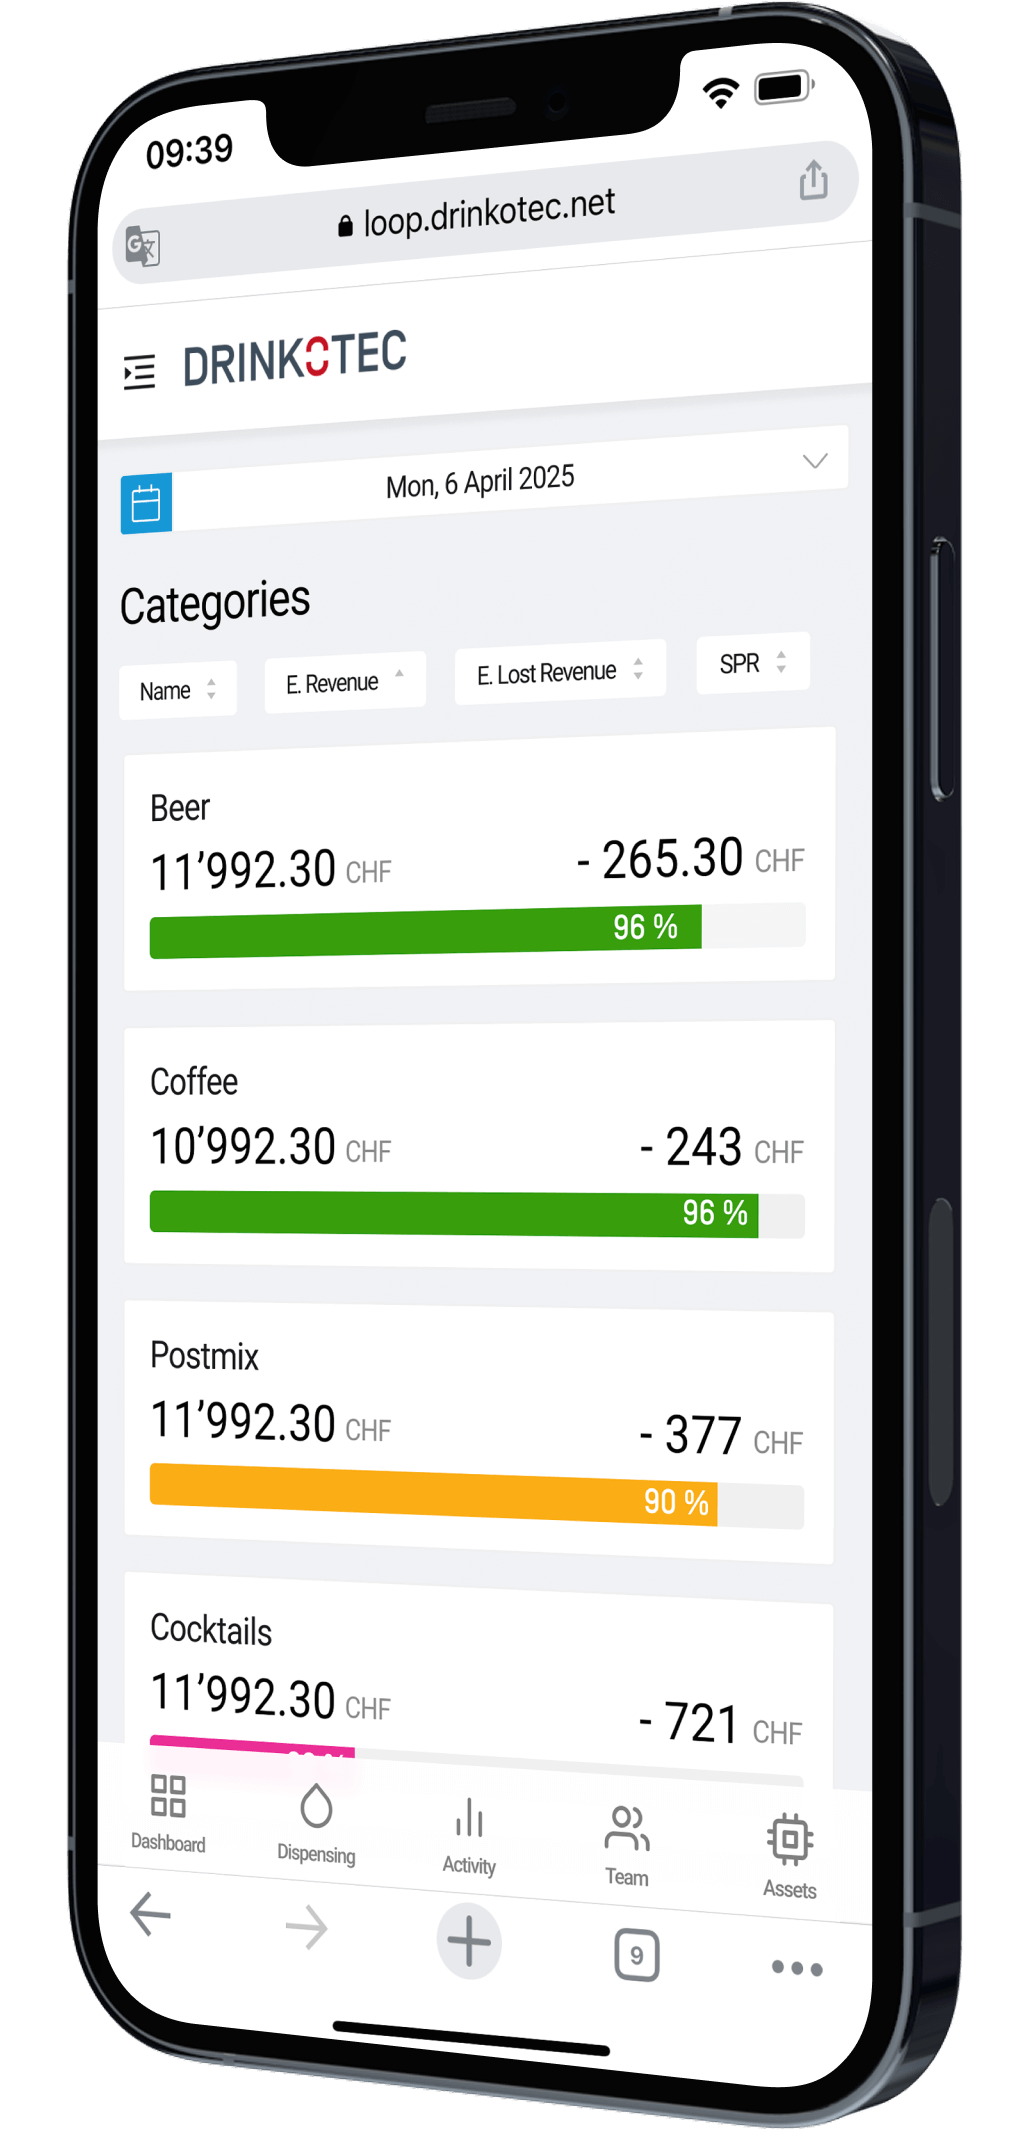
- Developed dynamic KPIs and comparison tools for managers to assess sales, trends, and team output.
- As part of the UI work, I also created a design system from scratch — including scalable components, color and typography rules, data visualization standards, and states for all interactive elements.
Result: A modern, scalable UI that delivers powerful insights without overwhelming users.
STEP 6
Prototyping & user testing
Goal: Validate usability and adjust based on real-world use.
What I did:
Result: Iterated and improved key components like tooltips, chart readability, and customizable layouts.
What I did:
- Built interactive prototypes of the key dashboards and flows.
- Conducted usability tests with both internal users and clients.
- Collected feedback on clarity, navigation, and content relevance.
Result: Iterated and improved key components like tooltips, chart readability, and customizable layouts.
Hi-Fi Designs


RESULTS & IMPACT
LOOP 360 Analytics is not just a data platform — it’s a unique IoT solution that gives Drinkotec a clear competitive edge.
Unlike standard industry tools, LOOP 360 is tightly integrated with the company’s proprietary beverage dispensing machines, offering a level of insight and control unmatched in the market. This end-to-end ecosystem is what makes Drinkotec stand out: it’s not just selling machines — it’s delivering an intelligent, connected service.
The platform helped clients shift from reactive operations to proactive, data-informed strategies, resulting in measurable business improvements:
- 30% reduction in machine downtime thanks to predictive diagnostics and remote monitoring
- Increased profitability for beverage operators who could now measure poured vs. sold volumes via metrics like SPR (Sold-to-Poured Ratio)
- Lower product waste and smarter inventory planning enabled by real-time data visibility
- Greater team accountability and motivation, driven by transparent performance metrics and sales comparisons
- Differentiated value for Drinkotec: LOOP 360 became a unique selling point in sales conversations — a digital advantage that clients couldn’t find elsewhere.
CONCLUSION
LOOP 360 Analytics is more than just a dashboard — it’s a tool that translates complex IoT data into actionable insight. Through a collaborative, technically grounded design process, we created a scalable platform that empowers clients to sell smarter, waste less, and operate with clarity.

Key Learnings from
the LOOP 360 Project
Designing for IoT means designing with constraints
Creating interfaces for connected devices is not only about aesthetics or UX logic — it's about understanding the physical and technical realities behind every data point. I learned to work closely with engineers to translate hardware limitations into meaningful, actionable experiences for end users.
User-centered design must bridge technical and business logic
In LOOP 360, I had to match what was technically possible with what was actually valuable for users. The process taught me how to align the system’s data layer with real user goals — turning raw metrics into KPIs that drive business impact.
Design systems bring clarity, speed, and scale
Building a design system from scratch helped me align cross-functional teams and speed up development. It also reinforced how visual consistency contributes to usability, maintainability, and long-term product scalability.
A strong information architecture is key to scaling across user roles
Working with three distinct personas — technicians, HoReCa managers, and beverage operators — reinforced the importance of a clear, role-based information structure. I learned how to deliver personalized data experiences without fragmenting the product architecture.
Collaboration is the core of product design
This project reminded me that great product design is not a solo act. I collaborated closely with developers, stakeholders, data analysts, field technicians, and end clients. That constant feedback loop was essential to turning a complex technical challenge into a valuable digital product.
Thank You For Watching
victoria.kulaeva@gmail.com
Designer
Victoria Kulaeva
Contact me


Have a project in mind? I'd love to hear about it. Contact me and let's talk.
Have a project in mind? I'd love to hear about it. Contact me and let's talk.